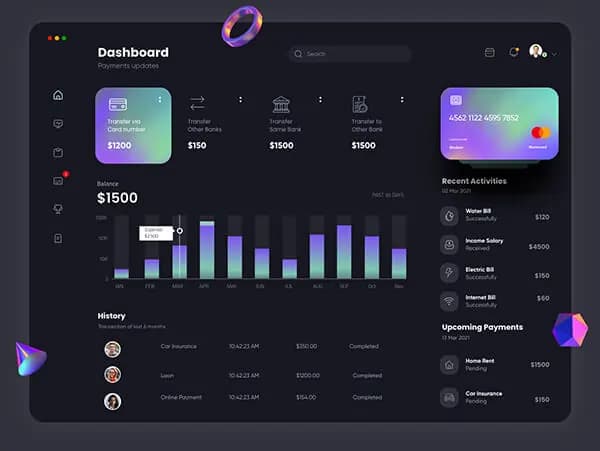
In today's data-driven business environment, organizations that can effectively analyze and interpret their data gain significant competitive advantages. Data analytics and business intelligence (BI) have evolved from nice-to-have capabilities to essential business functions.
Understanding Data Analytics vs Business Intelligence
Data Analytics
Data analytics focuses on examining raw data to draw conclusions and identify patterns. It includes descriptive, diagnostic, predictive, and prescriptive analytics to answer different types of business questions.
Business Intelligence
BI encompasses the technologies, processes, and practices used to collect, integrate, analyze, and present business information. It's about making data accessible and actionable for decision-makers.
Types of Analytics
Descriptive Analytics
Answers "What happened?" by summarizing historical data. Examples include sales reports, website traffic analysis, and financial performance dashboards.
Diagnostic Analytics
Explores "Why did it happen?" by examining data to understand the root causes of trends and anomalies.
Predictive Analytics
Forecasts "What might happen?" using statistical models, machine learning, and historical data to predict future outcomes.
Prescriptive Analytics
Recommends "What should we do?" by suggesting actions based on analytical insights and optimization algorithms.
Essential BI Tools and Platforms
Microsoft Power BI
User-friendly platform with strong integration with Microsoft ecosystem. Excellent for creating interactive dashboards and reports with minimal technical expertise required.
Tableau
Industry leader in data visualization with powerful drag-and-drop capabilities. Best for complex visualizations and advanced analytics.
Google Analytics and Looker
Google's suite offers web analytics and business intelligence capabilities with strong integration with Google Cloud Platform.
Open Source Options
Consider Apache Superset, Metabase, or Grafana for cost-effective solutions with customization flexibility.
Building a Data-Driven Culture
Data Governance
Establish clear policies for data quality, security, and access. Implement data governance frameworks that ensure data integrity and compliance.
Key Performance Indicators (KPIs)
Define meaningful metrics that align with business objectives:
- Financial KPIs: Revenue growth, profit margins, cost per acquisition
- Operational KPIs: Efficiency metrics, quality scores, customer satisfaction
- Strategic KPIs: Market share, brand awareness, innovation metrics
Data Collection and Integration
Data Sources
Modern businesses collect data from multiple sources:
- CRM systems and sales platforms
- Website and mobile app analytics
- Social media and marketing platforms
- Financial and operational systems
- IoT devices and sensors
ETL Processes
Extract, Transform, Load (ETL) processes ensure data is properly collected, cleaned, and integrated into your analytics platform. Consider tools like Talend, Pentaho, or cloud-based solutions like AWS Glue.
Advanced Analytics Techniques
Statistical Analysis
Use statistical methods to identify correlations, test hypotheses, and validate assumptions. Understanding statistical significance and confidence intervals is crucial for accurate interpretation.
Machine Learning Integration
Incorporate ML algorithms for:
- Customer segmentation and personalization
- Fraud detection and risk assessment
- Demand forecasting and inventory optimization
- Recommendation engines
Data Visualization Best Practices
Choose the Right Chart Type
Select visualizations that best represent your data:
- Line charts: Trends over time
- Bar charts: Comparisons between categories
- Scatter plots: Relationships between variables
- Heat maps: Pattern identification in large datasets
Design Principles
- Keep it simple and focused
- Use consistent color schemes and branding
- Provide context and explanations
- Make it interactive when beneficial
- Ensure accessibility for all users
Common Challenges and Solutions
Data Quality Issues
Implement data validation rules, regular quality checks, and automated cleansing processes to maintain data integrity.
Siloed Data
Break down data silos by implementing unified data platforms and encouraging cross-departmental collaboration.
Skills Gap
Invest in training programs and consider hiring data analysts or partnering with analytics consultants to build internal capabilities.
Measuring ROI of Analytics Initiatives
Track the business impact of your analytics investments:
- Cost savings from improved efficiency
- Revenue increases from better decision-making
- Risk reduction from predictive insights
- Customer satisfaction improvements
Data analytics and business intelligence are powerful tools that can transform how organizations operate and compete. By implementing robust analytics capabilities, fostering a data-driven culture, and continuously improving your analytical processes, you'll unlock valuable insights that drive business growth and success.